Our statistics: New visualisation tool – Financing and investment dynamics
The tool aims to make easier the analysing and increase the understanding of “who finances whom” among non-experts.
In order to maximise its outreach, the new visualisation tool will include not only euro area but also national statistics and is available in all twenty-three EU languages as of 28 April 2017. The visualisation can be embedded easily in external websites, such as online newspapers.
The new visualisation tool presents the statistics in the form of network graphs and explanatory text. The visualisation presents the financial interconnectedness within and between institutional euro area/national sectors and between them and the rest of the world. Users can select individual financial instruments, sectors, country, language and time dimensions to better understand who is financing whom and who is investing where within the economy.
Example 1:
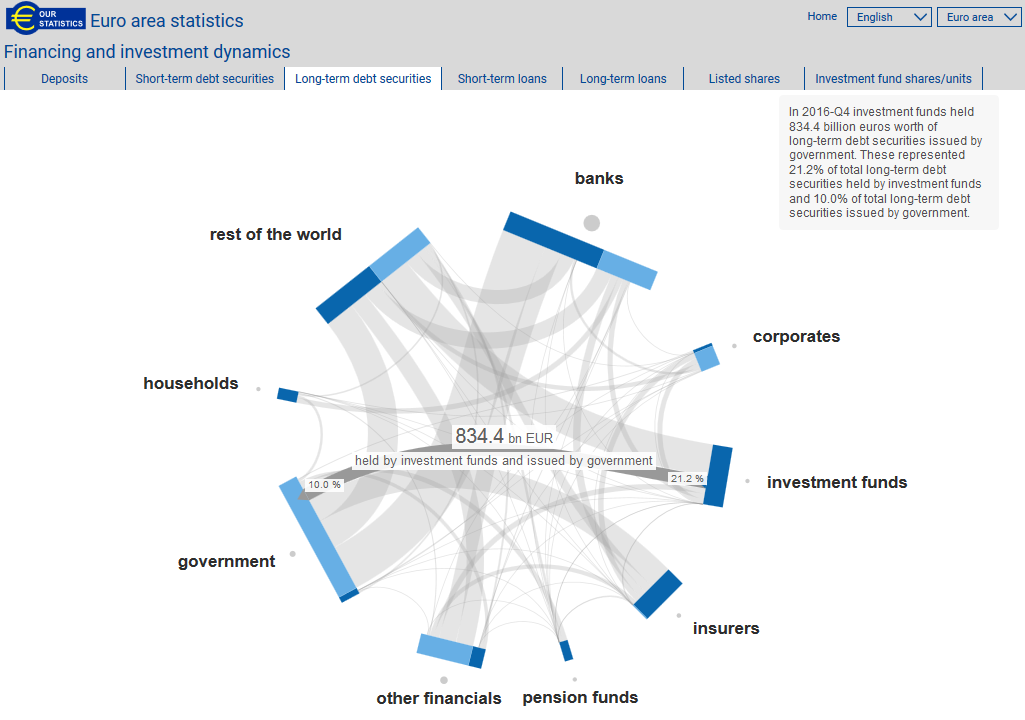
Euro area investment funds held 834.4 billion euros worth of long-term debt securities issued by euro area government, as at 31.12.2016. From the euro area government point of view it means, that 10% of total long-term debt securities issued was held by euro area investment funds.
Example 2:
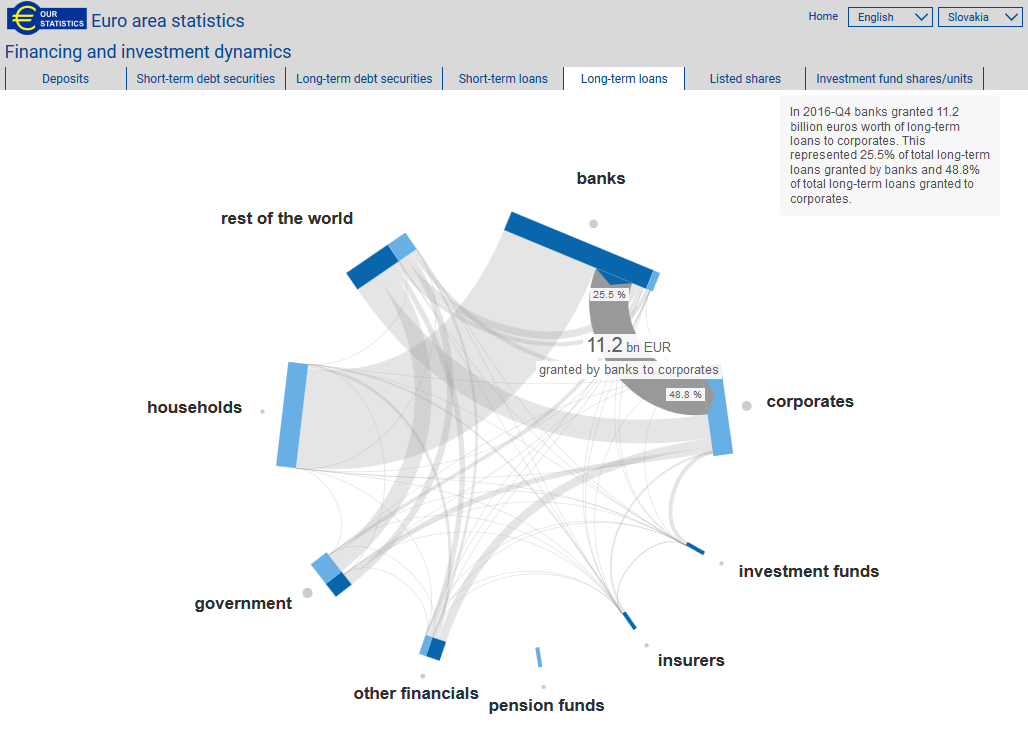
As at the end of 2016 the share of domestic banks in total corporates financing from long-term loans stood at 48.8%. The stock of these loans was 11.2 billion of euros and 25.5% of the total amount of long-term loans granted by domestic banks.
National Bank of Slovakia
Communications Section
Imricha Karvasa 1, 813 25 Bratislava, Slovak Republic
Tel.: +421-2-5787 2142, +421-2-5865 2142, +421-2-5787 2169, +421-2-5865 2169
Internet: http://www.nbs.sk
Reproduction is permitted provided that the source is acknowledged.